
Backtest trading strategies, free.
Run a strategy over the chart's history and read the result: key stats, an equity curve against buy and hold, a breakdown of profits and losses, and every trade, which you can show on the chart.
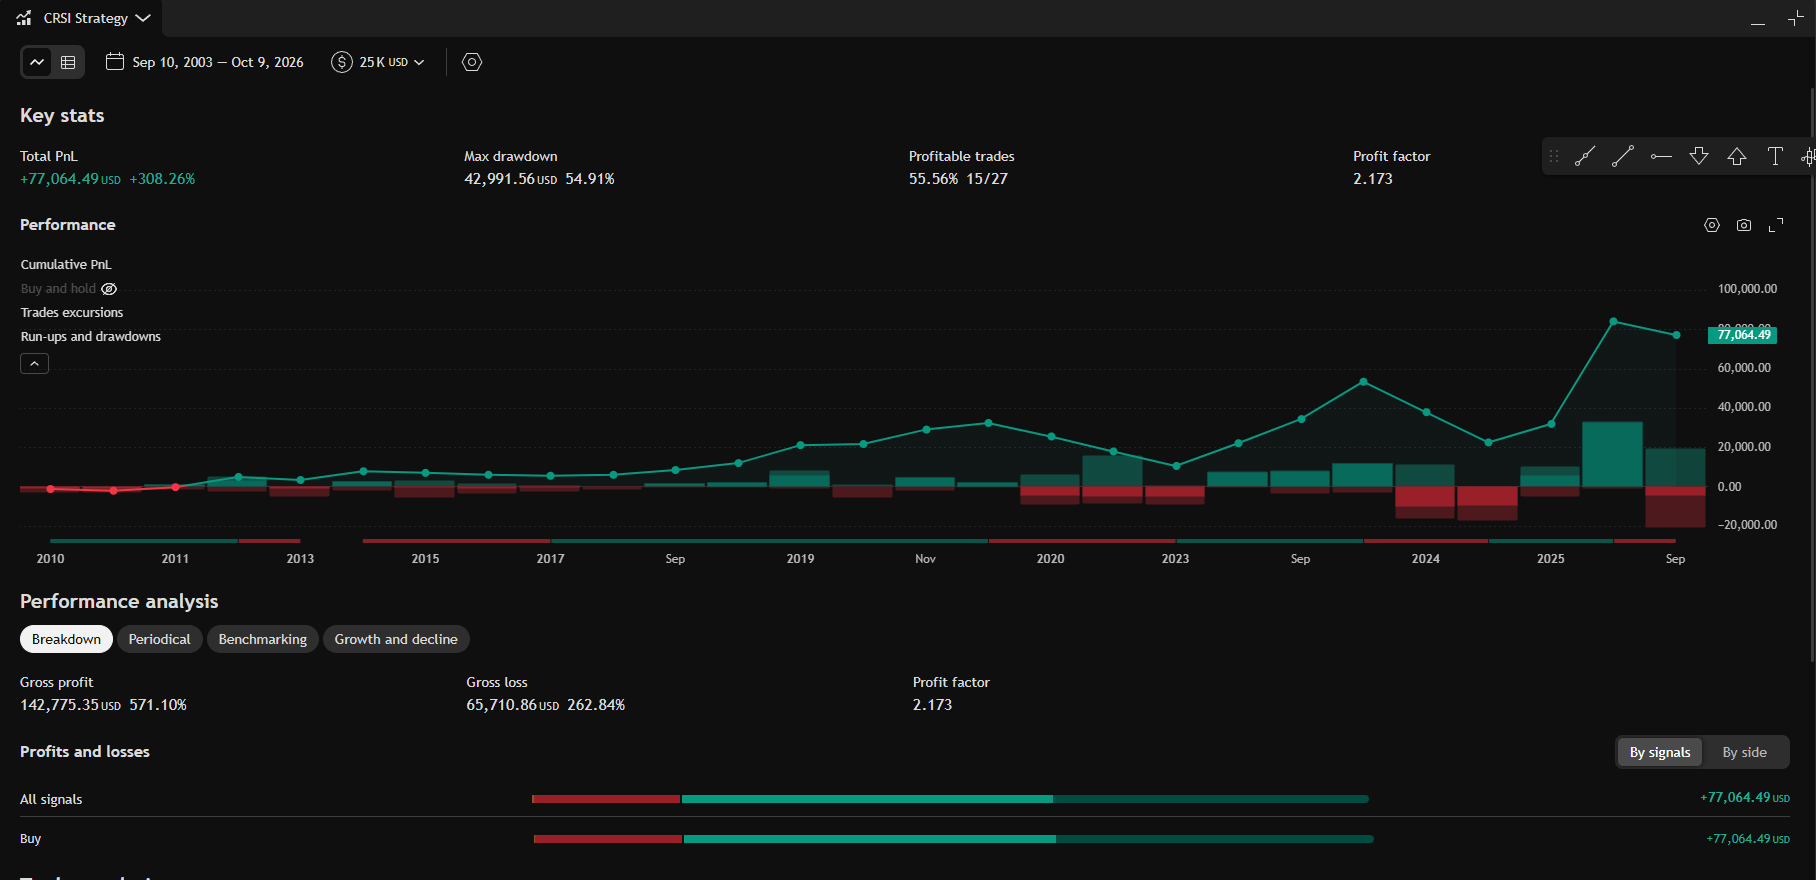
From an idea to a report in a few clicks
Add a strategy to the chart like an indicator. The report opens under the chart and updates when you change the symbol, the interval or a setting.
Strategies to start from
23 standard strategies such as MACD, Supertrend, Bollinger Bands, Parabolic SAR and technical ratings, and dozens more from the community collection.
Your own strategies
Write a strategy in the built-in OakScript editor and test it the same way. See scripting.
Realistic settings
Initial capital and currency, order size in shares, cash or percent of equity, pyramiding, commission, slippage, leverage, limit order fills and an order delay.
Finer fills
Bar detail can use lower-timeframe bars for the fills, and the strategy can also run on each realtime tick instead of only at bar close.
A full report
Total profit, max drawdown, profit factor, win rate, CAGR, Sharpe and Sortino ratios, expectancy, run-ups and drawdowns, streaks, and results by hour, day and month.
Charts of the result
Equity curve with buy and hold, run-ups and drawdowns, periodical returns, benchmark comparison, margin use, returns distribution and winning and losing streaks.
Every trade
The list of trades with entry, exit, profit, run-up, drawdown and duration. Click a trade to see it on the chart.
Export
Download the trades as CSV, or the whole report as an XLSX workbook with about 60 metrics.
Strategies on the chart
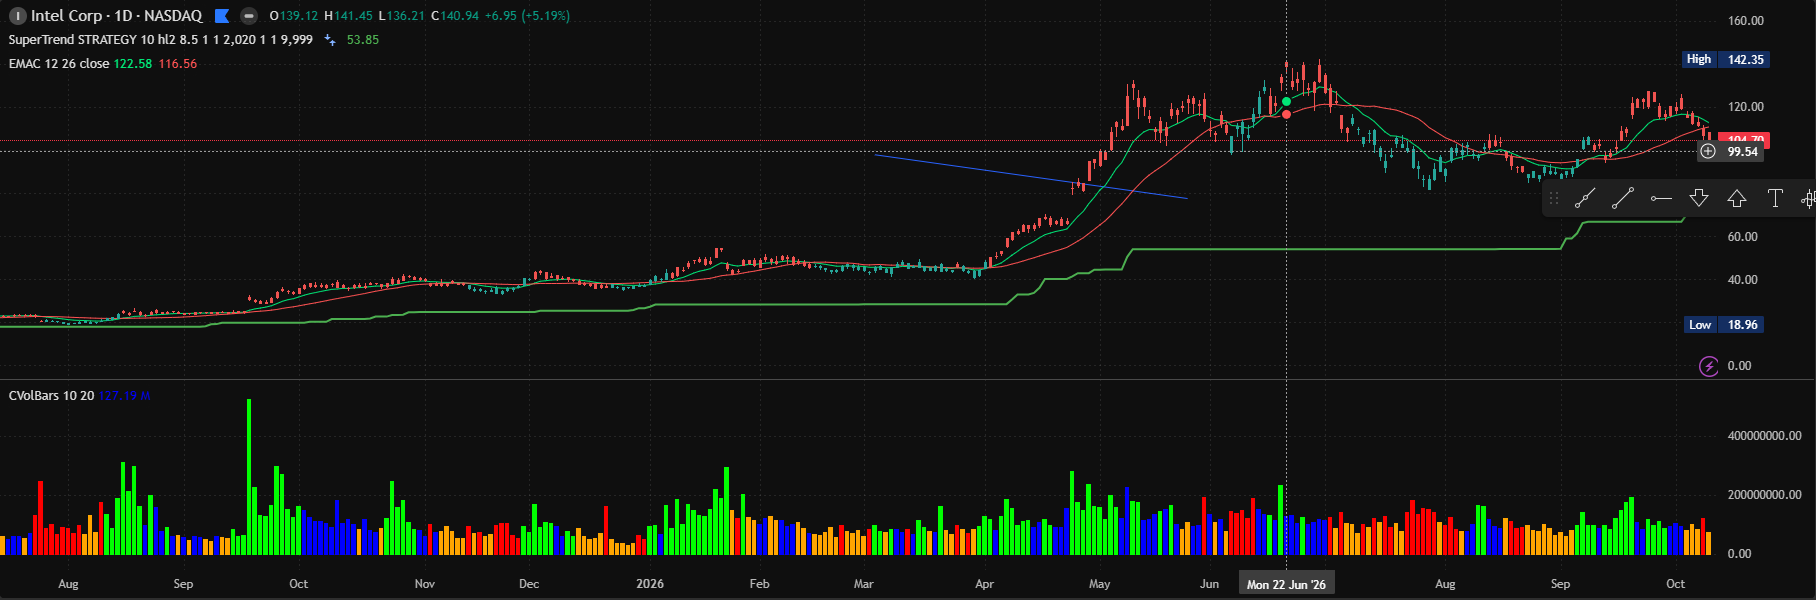
Entries and exits are drawn on the chart, next to your indicators and drawings, so you can see where the strategy traded and why.
Questions
Is backtesting free?
Yes, with no limit on the number of strategies or tests. The app is free and open source.
How much history can I test on?
The test runs on the bars the chart has loaded: daily history goes back to 2003, second and minute history to five years.
Can I test my own strategy?
Yes. Write it in the OakScript editor, in JavaScript-like syntax, and add it to the chart.
Can I trade the strategy live?
No. OpenTrader has no broker connection. Use alerts to be told when your conditions are met.
Everything else in the app
Try it. It takes a minute.
Free for Windows, macOS and Linux. Or open the demo in your browser.